
Realistic scenario
Pre-populated data lets you understand the platform without setup work.
Follow Aurora Retail: check the 180 outstanding pallets, simulate a recovery of 20 and see quantities and exposure change. The guide is inside the platform alongside operations, stock and management.
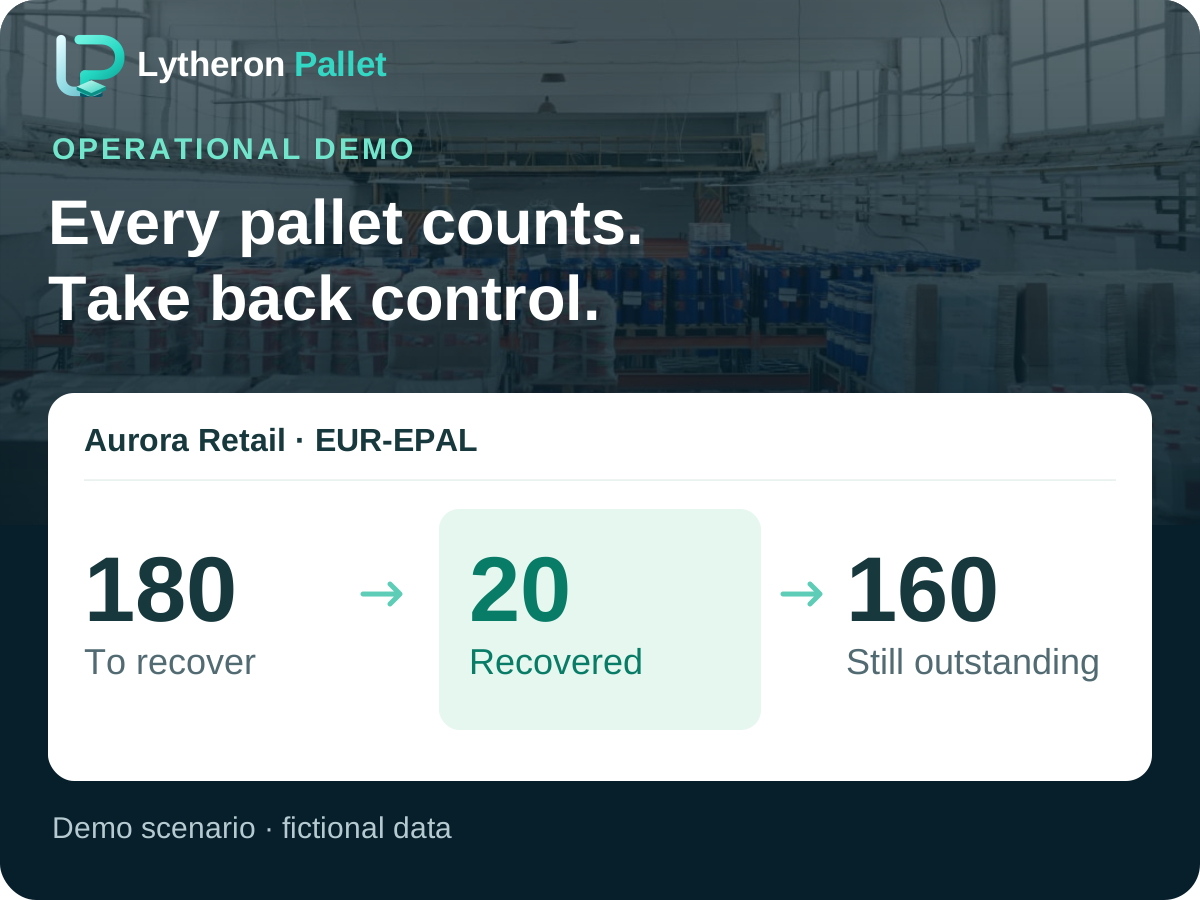
Aurora Retail is a fictional demo company. The system records 600 EUR-EPAL pallets OUT and 420 IN: a theoretical balance of 180. A voucher and case help manage the discrepancy; they do not prove a physical return.
Fictional demo data. Pallets count as recorded recoveries only after an operational outcome is entered; the business must verify physical returns and evidence.
Pre-populated data lets you understand the platform without setup work.
Navigate dashboards, operations, recovery, stock, customers and management control.
Demo data is separated from production customer data and can be reset.
Follow the guide inside the demo, then explore the other modules.
Explore a fictional business scenario
Simulate activities in your isolated workspace
Evaluate the workflow before importing your data
Beyond the opening scenario, use the demo to understand how the main operating areas behave.
Operational KPIs, exposure, due dates, anomalies and priority actions in one dashboard.
Import or record pallet flows, compare OUT/IN and identify imbalances and missing evidence.
Open recovery cases, assign priorities, keep evidence and follow every event to closure.
Physical stock by condition, transfers, pickups, deliveries, inspections, repairs and circularity.
Give customers an isolated view of their balances, movements, operations, documents and cases.
Operational revenue, direct cost, contribution margin, cost per cycle and visible data gaps.
Movements, evidence, deadlines, ownership and economic outcome stay connected in the same workflow.
Try the workflow in an isolated workspace for 2 hours. Name, email and company are required; no card and optional marketing consent.